May 16 & 17, 2017 Quiz 6D

Objective: Students demonstrate what they know about Monetary and Fiscal Policy by taking Quiz 6D.  Students will work in their Project Teams

Click here to take Quiz 6D Monetary and Fiscal Policy

You will have two attempts to take this quiz.  Check your answers after your first attempt and try again to improve your score.  The  highest score will be recorded.

When you have completed the quiz you will have the rest of the period to work in your project teams.

May 15 & 16, 2017 Fiscal Policy

Objective:  Students will learn about Fiscal Policy and how it can impact the economy by watching two videos and completing a worksheet. Students will work in their project teams.

Use the Fiscal Policy Worksheet in Google Classroom to capture information about Fiscal Policy.

John Maynard Keynes

Waist-up profile of an older man wearing a dark suit.

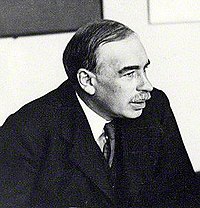
Keynesian economics theory states that governments can influence economic productivity levels by increasing or decreasing tax levels and public spending.


Criticisms of Fiscal Policy

Image result for 2017 breakdown of us government spending

https://i0.wp.com/www.americanthinker.com/legacy_assets/articles/assets/6%2011Figure%201.jpg

https://i0.wp.com/partners4prosperity.com/wp-content/uploads/2013/03/tax-rate-history-us-chart.png

https://briangottlob.files.wordpress.com/2012/12/transfer-payments1.jpg

Image result for graph of transfer payments

Quiz next class over Monetary and Fiscal Policy.  There will be 10 questions and you will have two attempts to take the quiz.

May 12, 2017 Quiz 6C

Objective: Students demonstrate what they know about taxes, consumer spending and economic growth by taking Quiz 6C.  Students will work in their Project Teams

Click here to take Quiz 6C

You will have two attempts to take this quiz.  Check your answers after your first attempt and try again to improve your score.  The  highest score will be recorded.

When you have completed the quiz you will have the rest of the period to work in your project teams.


May 10 & 11, 2017 Monetary Policy

Objective:  Students will learn about the role of the Federal Reserve and Monetary Policy by watching videos, reading Monetary Policy Notes and completing the Monetary Policy Worksheet.

Federal Reserve Regions

Image result for federal reserve regions

The Biggest Bank in Every State

Slide 1 of 51: <p>Big banks often get a bad rap. They're seen as impersonal and more likely to look out for their bottom line rather than the customer. But that's not necessarily the case.</p><p>There are plenty of <a href="https://www.gobankingrates.com/banking/advantages-disadvantages-banks/">advantages to big banks</a>. They usually offer a range of products and services and can be one-stop shops for your financial needs. Plus, the largest bank in your state might actually be a community bank with a focus on developing strong relationships with customers.</p><p>To pinpoint the biggest bank in each state, GOBankingRates used the Federal Deposit Insurance Corporation's directory to find the largest bank by assets in each state. In four states, Illinois, Massachusetts, New York and Utah, the second largest banks are listed because the largest provide investment and wealth management services rather than traditional banking services. </p><p>Click through to discover which bank is the largest in your state and to learn if its <a href="https://www.gobankingrates.com/banking/must-have-features-best-bank-accounts-offer/">product offerings are right for you</a>.</p>

Use these Monetary Policy Notes to complete the Monetary Policy Worksheet in Google Classroom.

Homework: Read the following articles

 Study for Quiz 6C Interest Rate Fluctuations and Business Cycle.  You will have two attempts to answer 10 questions.

April 28, 2017 Business Cycle, Monetary and Fiscal Policy

Objective: Students will discuss the homework reading assignment LAP EC-009 Boom or Bust.  Each team will discuss the Business Cycle Fact Sheet and decide if the statements are true or false.  Teams will work on their projects.

http://www.moneycrashers.com/leading-lagging-economic-indicators/

https://youtu.be/EMHkiKxtlvw

http://www.investopedia.com/video/play/business-cycle/

Work in your teams to answer the questions on Business Cycle Worksheet

http://www.socialstudieshelp.com/eco_business_cycle.htm

 Homework: Read pages 482-486 in Business a Changing World (The American Financial System to Banking Institutions) and answer questions 3 and 4 on page 498.


May 5, 2017 Quiz 6B Consumer Spending & Unemployment

Objective:  Students will demonstrate what they know about Consumer Spending and Unemployment by taking Quiz 6B

Click here to take Quiz 6B

  • Your user name is  jfk[student#]
  • Your password is 8digit birthday

You will have two attempts to take this quiz.  Review your answers after the first attempt and take it again to improve your score.  The highest score will be recorded.

When you have completed both attempts you can use the rest of the period to work on your project with your team.

Homework:  Read LAP EC-009 Boom or Bust answer the Total Recall Questions on pages 5 and 8 Due May 8 & 9, 2017


May 3 & 4, 2017 Interest Rates

Objective:  Students will discuss the readings on Interest Rates and will work with their teams to answer the questions on the Interest rate Worksheet.


1. Nominal Interest Rates vs. Real Interest Rates

Suppose we buy a 1 year bond for face value that pays 6% at the end of the year. We pay $100 at the beginning of the year and get $106 at the end of the year. Thus the bond pays an interest rate of 6%. This 6% is the nominal interest rate, as we have not accounted for inflation. Whenever people speak of the interest rate they’re talking about the nominal interest rate, unless they state otherwise.

Now suppose the inflation rate is 3% for that year. We can buy a basket of goods today and it will cost $100, or we can buy that basket next year and it will cost $103. If we buy the bond with a 6% nominal interest rate for $100, sell it after a year and get $106, buy a basket of goods for $103, we will have $3 left over. So after factoring in inflation, our $100 bond will earn us $3 in income; a real interest rate of 3%. The relationship between the nominal interest rate, inflation, and the real interest rate is described by the Fisher Equation:

Real Interest Rate = Nominal Interest Rate – Inflation

Work with your teammates to complete Nominal Interest vs. Real Interest Rate Worksheet

Homework:  Read LAP EC-009 Boom or Bust answer the Total Recall Questions on pages 5 and 8 Due May 8 & 9, 2017

Quiz on Friday May 5, 2017 over Consumer Spending and Unemployment.  You will have two attempts on this quiz.

May 1 & 2, 2017 Unemployment

Objective:  Students will discuss the readings on Unemployment with a partner and share what they discuss with the class.  Students will work in their project teams.

Class Work:  Read these two articles on Unemployment with your team and identify the key points in each paragraph.  Be prepared to lead the discussion with the class on one or more of the paragraphs.

  1. The Cost Of Unemployment To The Economy
  2. How Does Unemployment Affect the Economy


Bureau of Labor Statistics Data

Homework: Read the following articles on Interest Rates

April 28, 2017 Quiz 6A

Objective: Students demonstrate what they know about taxes, consumer spending and economic growth by taking Quiz 6A.  Students will discuss the concept of business expansion.

Click here to take Quiz 6A

You will have two attempts to take this quiz.  Check your answers after your first attempt and try again to improve your score.  The  highest score will be recorded.

When you have completed the quiz you will have the rest of the period to work in your project teams.

Homework:

Read Economic Cycles and Productivity p. 15 to p. 23 in Business A Changing World.  In your Google Classroom, answer Questions 7 – 10 on p. 28.


April 26 & 27, 2017 Consumer Spending

Objective:  Students will work in their project teams to read the assignment below and be prepared to summarize the key concepts at the beginning of the next class.

Do Now:  Respond to the following in a Google Doc attached to the assignment in Google Classroom

  1. Which do you think has more influence on prices, Supply or Demand?  Why?
  2. As a consumer how much does price influence your buying decisions?
  3. What other factors influence your buying decisions?
  4. Are you willing to wait and save to buy a more expensive item?  Why?
  5. Would you choose to borrow money so you could buy a more expensive item sooner? Why? 

Teamwork and Homework:
You all are responsible for reading all of these two articles. 

Each team will identify the key learning in the highlighted sections you have been assigned below and will present them at the beginning of the next class. 

Everyone will be responsible for taking notes on what is presented


Consumer Spending and the Economy (Team 1 Yellow,  Team 2 Blue)

Consumer Spending Drives the Economy (Team 3 Yellow, Team 4 Blue, Team 5 Green)


April 24 & 25, 2017 Inflation

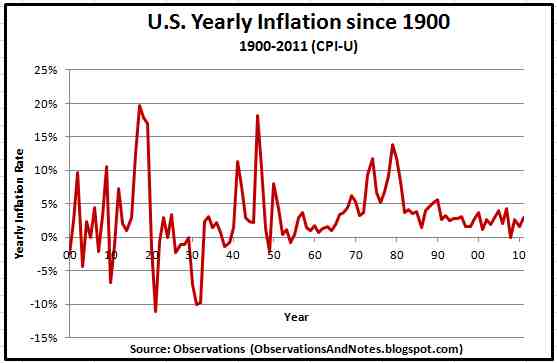
Objective:  Students will learn about inflation and how it impacts the economy by reflecting on and discussing the homework assignment and watching videos.

Do Now:  Respond to the following in a Google Doc attached to the assignment in Google Classroom.

  1. What happens to a balloon when it is inflated?
  2. What happens to a balloon when it is deflated?
  3. What happens to prices of goods and services when there is inflation in the economy?
  4. What happens to prices when there is deflation in the economy?
  5. Based on what you know about supply and demand, what causes prices to rise?
  6. What causes prices to decrease?

What is Inflation?

http://www.investopedia.com/articles/06/gdpinflation.asp

aa10b-u-s-yearlyinflationsince1900

Positive Impacts of Inflation

  1. Higher short term savings account interest rates
  2. Lower cost to travel abroad
  3. Borrowers pay back loans with devalued money.
  4. Higher Wages
  5. Increased Cost of Living Adjustments (Social Security, Medicare)

How can inflation be good for the economy?

http://www.investopedia.com/ask/answers/111414/how-can-inflation-be-good-economy.asp

Negative Impacts of Inflation

  1. Goods and Services cost more
  2. Interest to Borrow money increases
  3. Adjustable Rate Loans Interest increases
  4. Hording of goods in anticipation of higher future prices
  5. Erosion of long term savings.

How does the Federal Reserve work to control inflation?

http://www.investopedia.com/video/play/how-can-government-control-inflation/

Homework: Read How Consumer Spending And Economic Growth Is Linked and answer the questions in the Google Doc attached to the assignment in Google Classroom.

April 19 & 20, 2017 Test 2

Objective: You will have one attempt to demonstrate what you know by taking Test2 covering:

  1. Standard of Living
  2. Fixed Cost
  3. Variable Cost
  4. Breakeven
  5. Productivity
  6. Organized Labor
  7. International Business Activities
  8. Nature of Quality & Quality Controls
  9. Specialization of Labor
  10. Taxes

This is an open note test.

When finished with the test, students will work in their project teams on their Group Plan and Contract due on Friday April 21, 2017.

Click here to take Test 2 

Your User ID is:  jfk[student#]

Your Password is: 8digit birthday

Homework: Read the article The Importance of Inflation and GDP and answer the questions in the Google Doc attached to the assignment in Google Classroom.

April 17 & 18, 2017 Taxes

Objective:  Students will learn to identify different types of taxes and the level of government that levy them by completing the Tax Note Catcher during class discussion.

Do Now: Respond to the following using a Google Doc attached to the assignment in Google Classroom.

  1. What is a tax?
  2. Who is responsible for establishing taxes?
  3. How are taxes used?
  4. Identify two kinds of taxes.

Click here for the Tax Notecatcher

In your teams complete the Tax Questions using what you have learned.

Homework:  Study for Test 2 covering the following:

  1. Standard of Living
  2. Fixed Cost
  3. Variable Cost
  4. Breakeven
  5. Productivity
  6. Organized Labor
  7. International Business Activities
  8. Nature of Quality & Quality Controls
  9. Specialization of Labor
  10. Taxes

There are 47 questions and you will have one attempt to take this test.   It is worth 100 Points.

Project #6 The Good Ol’ Days

https://jfkhsob.files.wordpress.com/2014/04/74048-great-depression-soup-line.jpg

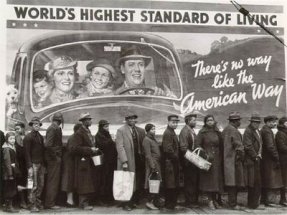
The Good Ol’ Days project helps students to develop an understanding of economic policies and measures through a study of present economic indicators and past economic events.

Each student will individually measure the health of today’s U.S. economy, and each team will research economic events that took place during a different assigned time period in the past 100 years.

Each team will study what caused these events; how government, businesses, and the American family responded to these events; the overall health of the U.S. economy during the time frame; and how good (or bad) life was during the time period as a result of economic events.

After conducting extensive research, each team will prepare a presentation/skit that explains what they have learned. The team presentations will be video recorded, and the video will be shared with eighth grade social studies students.

Just how good were the “Good Ol’ Days”?

  • How healthy was the U.S. economy during your assigned time period?
  • What economic events took place during your assigned time period?
  • What was their impact on the American family?
  • How did the government cause and/or respond to the economic event(s) in your assigned time period?
  • How did these government actions affect the American family?
  • How did businesses respond?
  • How did businesses’ responses affect the American family?
  • What did the American family look like in your assigned time period?

Part 1 Team Project

  1. Using the driving questions as guideposts, each team conducts extensive research of its assigned time period to develop an understanding of the health of the U.S. economy during that time frame, significant economic events that occurred, and the impact on the American family.  Each team will create a timeline using http://www.timetoast.com/ to identify the significant events in your assigned time period.
  2. As a result of this research, each team develops a five-to-seven minute skit that answers the driving and supporting questions in simple terms. Team members should portray different members of an American family typical of the period.  It is important that each team learn who made up the typical American family during their time period, what jobs were common at that time, how people dressed and spoke during the time, etc.

Team Assignments

Time periods

  • 1900-1929   Team 1
  • 1930-1959   Team 2
  • 1960-1989   Team 3
  • 1990-2017   Team 4

Part 2 Individual Reflection

Each student will compose a 2-page individual written reflection piece that requires him/her to consider the purpose of studying economic indicators, policies, and events of the past. Cite your sources as you answer the following questions:

  • What’s the benefit of looking at economic indicators and policies over time?
  • Why should we learn how government and businesses cause and/or respond to economic events?
  • Why should we learn how the American family can be affected by economics?

Time frame

April 17 & 18 2017

April 19 & 20, 2017

  • Objective Exam
  • Teamwork

April 21, 2017

  • Teamwork – Project Plan and Contracts Due

April 24 & 25, 2017

  • Briefing on Inflation
  • Teamwork

April  26 & 27, 2016

  • Briefing – Consumer Spending
  • Briefing – Economic Expansion and Contraction
  • Teamwork

April 28, 2017

  • Quiz 6A Gross Domestic Product, Economic Expansion and Contraction
  • Teamwork

May 1 & 2, 2017

  • Briefing – Unemployment Rates
  • Teamwork

May 3  & 4, 2017

  • Briefing – Interest Rate Fluctuations
  • Teamwork

May 5, 2017

  • Quiz 6B Consumer Spending and Unemployment Rates
  • Teamwork

May 8  & 9, 2017

  • Briefing – Briefing – Business Cycle
  • Teamwork

May 10 & 11, 2017

  • Briefing – Monetary Policy
  • Teamwork

May 12. 2017

  • Quiz 6C Interest Rate Fluctuations and Business Cycle
  • Teamwork

May 1516, 2017

  • Briefing – Fiscal Policy and Government Expenditures
  • Teamwork

May 1718, 2017

  • Teamwork

May 19, 2017

  • Team  Presentations (Be ready to go at the beginning of class)
  • Individual Reflections Due

May 22 & 23, 2017

  • Final Exam Review

May 24, 2017

  • To Infinity and Beyond

May  2526, 2016

  • Final Exam


April 6 & 7, 2017 Quiz 3B, Exchange Rates

Objective:   Students will demonstrate what they know about Fixed, Variable Costs, Breakeven and Organized Labor.

Click here to Take Quiz 3B

Do Now: Respond to the following in a Google Doc attached to the Google Classroom assignment.

  1. How could a person buy items with cash if she or he went to another country?
  2. How would a person get the currency from another country?
  3. How would a person know how much foreign currency an American dollar is worth?
  4. What is an exchange rate?

Click here for an interactive World Atlas

The formula is:

                             Exchange Rate

In your teams complete the Currency Exchange Scavenger Hunt

Record your answers on the Exchange Rate Scavenger Hunt Answer Sheet

Use these Exchange Rates to calculate the currency exchanges.

Project #5 Seven Days and Six Nights

Image result for international travel

Project Overview: Students will explore international vacation destinations to develop an understanding of exchange rates and the value of the dollar in other countries. Each team will conduct thorough research of multiple vacation destinations outside of the United States and then select the one that team members believe would allow a person to get the most for $4000. The team will then develop a non-PowerPoint/Google Slides presentation that creatively explains their international vacation destination choice, incentives involved, the exchange rate, and expenses incurred during the week-long vacation.

After conducting extensive research, each team determines where in the world one individual could get the most vacation outside of the United States for $4000/person. The team must consider:

  • round-trip transportation
  • lodging for six nights
  • three meals per day for seven days
  • cost of tourist activities/excursions
  • ground transportation in country

After determining the most economical international vacation setting, the team creates an presentation to explain the reasons for choosing their vacation destination.  Each team should choose how they want to present their choice using any presentation style other than a PowerPoint or Google Slide show

Include the following information in your presentation:

  • List all of  the international destinations that were considered as possible vacation alternatives. (You must evaluate at least 3 locations)
  • Explain the rationale for the vacation destination selected (use a Decision Matirx Template)
  • The vacation destination, mode of transportation, type of lodging, source of meals, and possible tourist activities/excursions.
  • Financial and non-financial incentives to go to the chosen international destination.
  • Listing of expenses: transportation, lodging, meals, and any tourist activities that the team has selected in U.S. Dollars and the local currency.
  • The vacation destination’s exchange rate. Click here for an exchange rate calculator. Express all expenses in U.S. Dollars and the local currency.
  • An explanation of what created differences in money values in the U.S. versus the vacation destination.

One presentation alternative is an interactive Glog/digital poster using Educator Code 6BBCBU that “sells” your vacation destination. The Glog/poster must be creative.

Another alternative is Prezi

Or choose one of these 5 Prezi Alternatives

Presentations will be graded using Oral Presentation Rubric

Click here to join a team.  Each team must have 3 or 4 members.  You choose which team you will join.

Time Frame

April 4 & 5, 2017

  • Project #5 Introduction
  • Briefing – Organized Labor
  • Teamwork

April 6 & 7, 2017

  • Quiz 3B Fixed and Variable Costs, Breakeven Analysis, Organized Labor
  • Briefing Exchange Rates
  • Teamwork

April 10 & 13, 2017

  • Teamwork

April 11, 2017 No Classes

April 12, 2017 (Periods 2 & 4 Only 30 Minute Classes)

  • Teamwork

April 14, 2016

  • Seven Days & Six Nights Presentation

March 15 & March 16, 2017 Quiz 3A & International Trade

Objective:  Students will demonstrate what they know about Productivity, Gross Domestic Product and Standard of Living by taking Quiz 3A.

Click here to take Quiz 3A 

Do Now: Respond in Google Classroom

  1. How does a tariff impact international trade?
  2. How is Outsourcing different from Offshoring?
  3. What is the difference between a Licensing and Franchising?

Objective:   Students will discuss International Trade and the barriers that can limit it based on the homework reading and capturing the key concepts using the International Business Note Catcher.

Students will learn about Balance of Trade by watching a video that can be found on the Video page under the Class link at the top of this page.   Students will work in their teams on the project.

https://www.bing.com/videos/search?q=trump+import+policy&&view=detail&mid=D6871BA738EAD7E746E3D6871BA738EAD7E746E3&FORM=VRDGAR

Homework: 

Homework: Read Get United LAP EC-005 and answer the Total Recall Questions on pages 6 & 8 in a Google Doc attached to the assignment in Google Classroom.

March 13 & 14, 2016 Quality Management

Objective:   Students will demonstrate what they know about Fixed, Variable Costs, Breakeven and Organized Labor.  Students will discuss Quality and Quality Controll based on the homework reading using the Quality Notecatcher

Handy Guide to TQM

Cost of Quality

Is 99.9% Good Enough

Homework: Read the following articles

  1. Ways to Export and Import,
  2. Read p 84-110 in Business in a Changing World textbook
  3. Answer questions 8-10 on page 113 in a Google Doc attached to the Google Classroom assignment.

Project #4 China Dynasty

Doing business in China

Project Description:

Individually, students will conduct secondary research to develop a written report comparing the production of goods in the U.S. to the production of goods in China.

Part 1 Individual Report

Each student will individually conduct secondary research and develop a three-page written report (double spaced 12 pt Times New Roman font with cited sources and bibliography)  covering the following concepts that compare the production of goods in the U.S. to the production of goods in China:

  • Comparison of China and U.S. workforces (size, education, income, union vs. non-unionized, trends in productivity, etc.)
  • Reasons U.S. companies have goods produced in China and reasons China chooses to produce goods for U.S. companies
  • How U.S. companies get goods produced in China (import/export from other companies, wholly owned subsidiaries, etc.)
  • How off shoring impacts the domestic economy
  • What problems U.S. companies encounter with goods produced in China
  • How quality issues with goods produced in China could be addressed
  • Sources to help you get started (you may use one of these and find at least three more on your own minimum of 4 cited sources)

The report will be graded using this Written Report Rubric

The Oral Presentation will be graded using this Oral Presentation Rubric

Part 2 Team Work

After completing their individual reports, each team of students will be given a stuffed animal and assigned the task of determining where they want to produce that item—in China or in the U.S. To make their decision, each team will need to consider a number of factors, including:

  1. How to produce the stuffed animal
  2. What issues or risks might arise in production
  3. How to deal with those issues and risks

After considering these factors, each team will develop and use a decision matrix to select where to produce its stuffed animal and then present an oral report explaining:

  1. Where the team chose to produce the item
  2. What risks are involved in making the stuffed animal in the selected location
  3. How the team would deal with these risks.

China Dynasty P2

China Dynasty P4

China Dynasty P7

Time Frame

03/03/2017

  • Test 1
  • Project Introduction

03/06 & 07/2017

  • Briefing Specialization of Labor &  Productivity
  • Individual Research

03/08 & 09/2017

  • Briefing on Fixed and Variable Costs
  • Individual Research Continued

03/10/2017

  • Briefing Standard of Living/GDP
  • Individual Research Continued
  • Individual report due next class

03/13 & 14/2017

  • Briefing Nature of Quality & Quality Controls
  • Individual Reports due
  • Start Project #4 Group Contract, Group Plan China Dynasty Team Contract and Plan due next class
  • Team work
    • Each team will receive their stuffed animals to determine it should be produced in the U.S. or in China.

03/15 & 16/2017

  • Quiz 3A (Outputs, Productivity, Standard of Living)
  • Briefing on International Business
  • Teamwork Project Contract and Plan Due.

03/17/2017

  • Briefing on Organized Labor
  • Teamwork

03/20 & 21/2017 (30 min classes  PARCC Testing)

  • Quiz 3B (Organized Labor, Fixed and Variable Costs, Breakeven Analysis)
  • Teamwork

03/22/2017 (30 min classes  PARCC Testing)

  • Teamwork

03/23 & 24/2017

  • Team Oral Presentations

March 10, 2017 GDP & Standard of Living

Objective: Students will learn about Gross Domestic Product and Standard of Living by reading articles and watching videos.  Students will capture what they learn using the Gross Domestic Product Standard of Living Note Catcher.  Students will continue their individual research for the paper due on March 13 & 14, 2017.

Watch these two videos:

 Homwork: Read the following articles on Quality Management

    1. Total Quality Management – Meaning and Important Concepts

    2. Total Quality Management – The Economist

    3. Cost of Quality

Individual Reports due March 13 & 14, 2017

Quiz over Outputs, Productivity and, Standard of Living on March 15,  & 16 and , 2017

March 8 & 9, 2017 Fixed & Variable Costs

Objective:  Students will learn how to identify Fixed cost, and Variable costs and calculate total cost total revenue the break even point.

Working with a partner, complete the Fixed and Variable Cost Worksheet due at the end of the period.

Fixed Costs = Costs of production that do not change with the volume of output produced

Examples of Fixed Cost:

  • Rent
  • Insurance
  • Salaries
  • Benefits

Variable Costs = Costs of production that change with the volume of output produced

Examples of Variable Costs:

  • Raw Materials
  • Packaging
  • Shipping
  • Hourly Wages

Graphing Fixed and Variable Costs

breakeven analysis chart

Total Cost = Fixed Costs + q(Variable Unit Cost)    q=quantity produced

Average Cost = Total Cost/q     q = quantity produced  

Total Revenue = qp                 q = quantity sold      p=price    

Breakeven = The quantity needed so that Total Revenue = Total Cost

Total Revenue = Total Cost

qp = FC + q(VC)

Classwork:  Using Fixed and Variable Cost Worksheet practice calculating costs. Due at the end of the period.

March 6 & 7, 2017 Productivity

Do Now: Respond to the following in a Google Doc attached to the assignment in Google Classroom:

  1. What is productivity?
  2. Why is productivity important to business?
  3. Why is productivity important to an economy?
  4. What are two ways that a business can improve productivity?

Objective:  Students will explore how to improve productivity in a work environment.   Working collaborative in their project teams they will review a case study and make recommendations for productivity improvements.

Wilson Football Factory Video

Assignment:  In your project teams read and review the Productivity Probe Use the information in the Improving Productivity Guide.  When you have made a recommendation turn it in to the Google Classroom assignment.

When finished with the Productivity Probe you may work on your Individual Report due on March 17, 2017

Homework: Read the following articles and be prepared to discuss next class.

Breakeven Point Analysis

Outsourcing Turns Fixed Costs into Variable Costs.

March 3, 2017 Test 1

Objective: Students will demonstrate what they know by taking Test1 covering Economics Review, Culture impact on economics, Supply and Demand, Prices, Innovation, Opportunity Cost, Decision Matrix.  Students will be introduced to the next project China Dynasty Project #4.

Click here to take Test 1

Homework:  Read LAP-EC-18 Make the Most of It and answer the Total Recall Questions on pages 5 and 8 in a Google Doc attached to  the assignment in Google Classroom

March 1 & 2, 2017 Make the Most of It Presentations

Objective:  Students will work in their teams to finalize their team presentations for 45 minutes and individual project diaries.

Due Today: Individual project diaries attach to the Google Classroom assignment.


Homework: Study for Test 1 covering:

  1. Economics Review
  2. Culture impact on Economics
  3. Supply and Demand
  4. Prices
  5. Innovation
  6. Opportunity Cost
  7. Decision Matrix

You will have one attempt to take the test.  There are 36 questions and the test is worth 100 points.  Review the quizzes and note catchers.

February 27 & 28, 2017 Quiz 2AB and Project work

Click here to take Quiz 2AB over Innovation Skills, Opportunity Cost, and Decision Matrix

Your User ID is jfk[student#]
Your Password is 8digit birthday

There are 20 questions on the quiz and you have two opportunities to take this quiz.  The highest score will be the grade recorded.

Objective:  Students will share the results of the stakeholder survey and finalize their decision matrix for their final recommendations and presentation.

Homework:  Finalize Team Written reports and presentations due on March 1 and 2, 2017. Next class you will have Project Team work first 45 minutes,Oral Presentations second 45 minutes

February 23 & 24, 2017 Opportunity Cost

Objective: Students will discuss what they read regarding Opportunity Costs and explore the concept of marginal utility by participating in a class activity and reflecting on the results.

Click here for Opportunity cost Power Point

Class Work:

  • Group Contract and Group Plan due

Bing Maps

  • Create Interview Questions to ask stakeholders and turn in.
  • Create a plan to interview businesses in the area of the property being developed to be discussed next class
  • Project Team work

Homework:  Read How to Use a Decision Matrix and complete the Decision Matrix Notecatcher in the Google Classroom assignment.

Use a Decision Matrix to decide what movie to see.

Choose from at least three different movies.

Quiz Next Class over Innovation, Opportunity Costs and Decision Matrix.  You will have two attempts to take the quiz and the highest score will be recorded.

February 21 & 22, 2017 Innovation.

Objective:  Students will finish presenting their Photo Hounds project team videos.  Students will discuss Innovation and its importance to the economy using the two homework reading assignments.  Students will start working on Make the Most of It Project #3.

Homework questions

  1. What is innovation?
  2. Innovation is the key to what in business?
  3. What are the four kinds of innovation?
  4. What kind of innovation is called for when the problem and domain are not well defined?
  5. What kind of innovation is called for when the problem and domain are both well defined?
  6. Breakthrough innovation is often come from who?

Class work:

In your project teams review the project requirements, create a Group Contract and Project Plan.

Homework: Read Opportunity Cost: A Primer and Opportunity Cost and answer the following questions:

  1. What is another name for Opportunity Cost?
  2. When analyzing Opportunity Costs consumers must consider what two factors?
  3. What is a Sunk Cost?
  4. What is an Explicit cost?
  5. What is an Implicit cost?

Project #3 Make the Most of It

vacant

Part 1 Team Project

Project Description: In this project, students will develop innovation and decision-making skills as they determine the best use for a vacant building in their community.

  • Each team will interview 10 residents and business people to learn what members of the community would like to see done with the vacant building.
  • Following these interviews, team members will identify the three best possible uses for the property and determine the opportunity costs of each choice.
  • Finally, after developing and using a decision matrix, each team will give an oral presentation and submit a written proposal to the in which the team explains its best use for the vacant building and rationale for the team decision.

Period 2 Make the Most of It

Period 4 Make the Most of It

Period 7 Make the Most of It

walmart-neighborhood-market

 Part 2 Individual Project Diary

In addition to team activities, each student will also keep an individual diary of events throughout the project to reinforce individual understanding of and participation in the project.  The diary should identify what the student did each day of the project and what they learned about making decisions that impact the community.

Time-frame

02/21 & 22/2017

02/23 & 24/2017

  • Briefing – Opportunity Cost & Decision Matrix
  • Group Contract and Group Plan due
  • Create Interview Questions and turn in.
  • Click here for the Excel Decision Matrix Template
  • Create a plan to interview businesses in the area of the property being developed
  • Project Team work

02/27 & 02/28/2017

  • Quiz over Innovation, Opportunity Cost and Decision Matrix
  • Project Team work
  • Click here to see the
  • Survey Questions

03/1 & 2/2017

  • Project Team work first 45 minutes
  • Oral Presentations second 45 minutes

Helpful Links

Denver Zoning Code

Bing Maps

Google Earth

Part 1 Team Activities

In order to determine the best use for the vacant building, each team must complete a series of steps. The steps involved are:

  1. Investigate zoning and assess the surrounding business community.
  2. Compose interview questions that could be used to find out what locals would like to see in place of the vacant building. After each team has written its interview questions, the class should compare the questions and select the best questions to use for the interviews.
  3. Interview people in vacant building’s neighborhood to learn what they would like to see in place of that vacant building. Each team member should interview at least two people in the neighborhood, and students should make an effort to get responses from both the business community and residents. Each team should compile a list of the interviewees’ names, addresses, and responses.
  4. After conducting the interviews, use feedback and innovation skills to brainstorm for specific uses of the property.
  5. Select the three best uses for the property from its list.
  6. Determine the opportunity costs associated with each of the three possible uses for the property. Consider such factors as potential revenue generated, jobs created, aesthetics of neighborhood, etc.
  7. Determine criteria for selecting the best use for the property.
  8. Develop and use a decision matrix to determine the best use for the vacant building.
  9. Develop a one-page written proposal to submit to the teacher. The written proposal explains the team’s decision about how to put the vacant building to best use and reasons why the team believes that is the best use for the property.
  10. Deliver a five-minute presentation

Part 2 Individual Activities

To ensure that all team members are engaged in the project, each team member will keep his/her own written diary of events. Each student will compose a one-to-two paragraph diary entry each day describing team activities and his/her own contributions to the team.

February 17, 2017 Photo Hounds Presentations

Objective:  Students will present their Photo Hounds videos.

Part 2 the Individual report on incentives for a company to “Go Green” is due on February 21 & 22, 2017

Homework: Read these two articles on innovation

  1. What is innovation

  2. 4 Types of Innovation

and answer the following questions in a Google Doc linked to this assignment in Google Classroom.

  1. What is innovation?
  2. Innovation is the key to what in business?
  3. What are the four kinds of innovation?
  4. What kind of innovation is called for when the problem and domain are not well defined?
  5. What kind of innovation is called for when the problem and domain are both well defined?
  6. Breakthrough innovation is often comes from whom?

February 15 & 16, 2017 Project Work Day

Objective:  Students will complete and turn in the Supply & Demand project that demonstrates their understanding of the impact of shifts in supply and demand.  Students will work to complete the Photo Hounds Project that will be presented next class.

The Photo Hounds Video is due on Friday February 17, 2017.  Part 2 the Individual report on incentives for a company to “Go Green” is due on February 21 & 22, 2017

February 13 & 14, 2017 Quiz 1B & Teamwork

Objective:  Students will demonstrate what they have learned about Supply and Demand and the role of Prices in the economy by taking Quiz 1B.  Following the quiz students will work in their teams to complete the Photo Hounds video project.

Click here to take Quiz 1B

When you have completed both rounds of the quiz, compare your answers on the Price Worksheet with the answer sheet.

When everyone has completed the quiz, you should work in your teams to complete your Photo Hounds video.  It is due Friday February 17, 2017.

The Supply and Demand Project is due Friday February 17, 2017

February 10, 2017 Impact of Price on Economics

Objective:  Students will learn and discuss the role that price plays in economic systems  by reading information found in LAP EC-012 When More is Less and discussing their responses to the Total Recall questions on pages 5 & 8:

Class Discussion:

Click here for Price Note Catcher

Click here for Price Worksheet

Quiz next class covering Supply and Demand and Prices.  This is an open note quiz.  You can use the Supply & Demand and Price Note Catchers on the Quiz.

Homework: Complete the Price Worksheet in Google Classroom.  Answers will be available next class.

February 8 & 9, 2017 Supply & Demand

Do Now: Respond to the following in a Google Doc attached to the assignment in Google Classroom:

  1. Why are some products and services more expensive than others?
  2. What are two factors that affect the supply of a product or service?
  3. What are two factors that affect the demand of a product or service?

Objective:  Students will learn and discuss the law of supply and demand  by reading information found in LAP EC-011 Supply and Demand and discussing their responses to the Total Recall questions on pages 4 & 8

Class Discussion:

Watch the Supply and Demand Video on the Video page.

Click here for Supply and Demand Note catcher

Click here for Effects of Supply and Demand Worksheet

Homework: 

  1. Complete the Supply and Demand Project Due on February 17, 2017.  This project is worth 100 points and will be shared with Arapahoe Community College.

  2. Read LAP EC-012 When More is Less the function of Prices and Answer the Total Recall questions on pages 5 and 8. Due February 10, 2017.

February 6 & 7, 2017 Quiz 1A

Click here to take Quiz 1A. 

Your User ID = jfk[Student #]
Your Password = Your 8 digit Birthday

You will have two attempts so review your answers after your first attempt and try again.  Your highest score will be recorded.

When you have completed the quiz you will have the remainder of the period to work on the Photo Hounds Project.

Your Project Plan and Group Contracts are due at the end of the period.  Link them to the Photo Hounds Project Part 1 assignment in Google Classroom.

Homework:  Read LAP-EC-011 Supply and Demand and answer the Total Recall questions on pages 4 and 8 in a Google Doc and link it to the assignment in Google Classroom.  Be prepared to discuss this LAP and turn in your answers next class.

February 1 & 2, 2017 Economic Incentives

Do Now: Respond to the following in a Google Doc attached to the assignment in Google Classroom.

  • Why do people use incentives?
  • Do all incentives work? Why?
  • Does everyone think and react in the same way about an incentive? Why?
  • Do you think economic incentives work better than non-economic ones? Why? Why not?

Objective:  Students will learn and discuss the impact of economic incentives on economic activity by reading information found at Economic Incentives in Our Community and discussing their responses to the homework questions:

Click here for Incentives Note Catcher

Click here to play Incentive Tic Tac Toe

Students will work in their project teams to begin work on the Photo Hounds project.

Class Work:   Create your Group Contract and Plan due on February 6 & 7, 2017

Quiz next class over Economic Activities, Cultural Impact on Economics and Incentives.

January 30 – 31, 2017 Project #2 Contract & Plan

Do Now: Respond to the following is a Google Doc attached to the assignment in Google Classroom:

  1. Give an example of an economic want.
  2. Give an example of a non-economic want.
  3. What does it mean to be ethnocentric?

Ovjective:  Students will investigate how economic incentives can influence how people make decisions on how to use economic resources by reading three articles.

Class Work:  Students worked in their project teams to create a Group Contract and Plan.  These are both due on February 6 & 7, 2017.

Homework:  Read the three articles and be prepared to discuss them next class.  Complete the Incentive Worksheet.

  1. Economics of Incentives
  2. Incentive
  3. Economic Incentives

Project #2 Photo Hounds January 30 – February 17, 2017

paparazzi-to-tiger-woods-you-did-this-you-re-ours-2

Driving Question:  What economic concepts could celebrities use to keep the paparazzi at bay?

Project description

Students will explore the world of celebrities and the paparazzi in order to develop an understanding of key economic concepts including supply and demand, the functions of prices, incentives, and the role of culture in the production, distribution, and consumption of goods and services. In teams, students will record infomercial videos that creatively address these key concepts as well as explain what they theorize celebrities could do to solve the problem of the pesky paparazzi.

Objectives of the project:

  • Analyze the role of culture in the production, distribution, and consumption of goods and services (paparazzi photos, celebrity status,
  • Discuss how incentives influence the economic behavior of individuals
  • Explain the principles of supply and demand
  • Describe the functions of prices in markets

Supporting Questions to be addressed in your team’s video:

  1. How do the paparazzi work?
  2. Why do the paparazzi hound celebrities?
  3. Do celebrities need the paparazzi?
  4. What incentives are at work here for celebrities? For paparazzi?
  5. How does the U.S. culture impact paparazzi’s actions?
  6. Why do the prices paid for celebrity photos fluctuate?
  7. How do the principles of supply and demand apply to the paparazzi situation?
  8. What could celebrities do to change the situation if they wanted to?
  9. Why would your solution work?


Period 2 Photo Hounds

Period 4 Photo Hounds

Period 7 Photo Hounds


Part 1 Team Infomercial Video Due on 02/17/2017

Each team conducts research and develops a 5-minute infomercial video creatively depicting their team’s answer to the driving question. To ensure that students master the economic concepts related to this project, students must also address the supporting questions through their video.

In addition to being evaluated by the teacher using the rubric, fellow students also screen and vote on each team’s video. The class selects the best idea for keeping the paparazzi at bay.   Videos will be evaluated using Video Rubric

Part 2 Individual Written Report Due on 02/17/2017

After completing the group portion of the project, each student writes a one-page report in which s/he applies the concepts of incentives and prices to businesses who are considering “going green”. What incentives influence a business’s decision to go “green?” How are prices influenced by a business’s decision to go “green?”  How will deciding to go “green” impact supply and demand for a product?  Written Reports will be evaluated using Written Report Rubric

Link your Individual Report to the assignment in Google Classroom.

Timeframe

02/1 & 2/2017

02/6 & 7/2017

  • Quiz 1A (Economic Activities, Culture Impact on Economics, Economic Incentives)
  • Group Contract and Plan Due
  • Teamwork on Video

02/8 & 9/2017

  • Briefing – Supply & Demand
  • Supply and Demand Project Assigned
  • Teamwork on Video

02/10/2016

  • Briefing – Prices
  • Teamwork on Video

02/13 & 14/2017

  • Quiz 1B (Supply and Demand, Prices)
  • Teamwork on Video

02/15 & 16/2017

  • Teamwork on Video

02/17/2017

  • Team Video Presentations in class
  • Individual Written Reports Due
  • Supply and Demand Project Due


January 27, 2017 Culture’s Impact on Economic Decisions

Do Now: Respond to the following in a Google Doc attached to the assignment in Google Classroom:

  1. Identify at least three things you need to know before you conduct business in another country?
  2. Identify a country, other than the United States, that you would like to explore.
  3. Why did you choose the country?

Objective: Students will investigate the cultural dimensions and culture’s impact on economic decisions by reading On Top of the World and exploring the Geert-Hofstede Cultural dimensions of different cultures.  If you do not finish in class complete the worksheet for homework.

Class Work/Homework:  Read LAP EC-024 On Top of the World and complete the Culture Worksheet

Using the country you identified in the Do Now, complete the second page of the Culture Worksheet by researching where it is on the Geert-Hofstede Cultural dimensions and how these cultural dimensions affect business and economic decisions.

Geert-Hofstede Cultural Dimensions

Power Distance measures the extent to which the less powerful members of organizations and institutions (like the family) accept and expect that power is distributed unequally.
Individualism is the one side versus its opposite, collectivism, that is the degree to which individuals are integrated into groups.
Masculinity versus its opposite, femininity refers to the distribution of roles between the genders which is another fundamental issue for any society to which a range of solutions are found.
Uncertainty Avoidance deals with a society’s tolerance for uncertainty and ambiguity; it ultimately refers to man’s search for Truth.
Long-Term Orientation is the fifth dimension of Hofstede which was added after the original four to try to distinguish the difference in thinking between the East and West.

Corruption Perceptions Index 2016 Survey Results

The Corruption Perceptions Index 2016 serves as a reminder that the abuse of power, secret dealings and bribery continue to ravage societies around the world.

The Index scores 177 countries and territories on a scale from 0 (highly corrupt) to 100 (very clean). No country has a perfect score, and two-thirds of countries score below 50. This indicates a serious, worldwide corruption problem. Hover on the map in the link to see how your country fares.

January 25 & 26, 2017 Lemonade Stand Economic Activities

Do Now: Respond to the following in a Google Doc attached to the assignment in Google Classroom:

  1. Name and give an example of the three kinds of economic resources
  2. Identify an example of each of these economic activities:
    1. Producer
    2. Distributor
    3. Consumer
  3. How do we exchange one kind of resource for another?

Objective:  Students will complete the reading and Lemonade Stand activity and write a reflection on the economic activities they experienced as a result of the simulation.

Assignment: 

  1. Complete the note catcher for the reading assignment Are You Satisfied LAP EC-006.
  2. Complete the Lemonade stand project (2 rounds) and turn in your Google Sheets tracking sheet.
  3. Respond to the reflection questions on the note catcher and turn it in.


Project #1 Lemonade Stand January 23 – 26, 2017


Objective: Students will explore economic resources and decision making by running a virtual lemonade stand for a 30 day simulation.  Students will record their daily sales and costs on a spreadsheet and reflect in writing on their results.

Virtually every decision that you and your friends make involves economics.

Driving Question: How can something as simple as Lemonade involve economics?

Please read all of the information in this post before you begin.

Choose your own teams of two people.  Each group will strategize how to sell lemonade and determine the key economic activities needed to be successful;  Production, Distribution, Exchange, and Consumption.  

You will be completing two rounds of selling lemonade for 30 days.  Each day you will receive a weather forecast on the TV.  Know that the forecast is not always correct.  One person on your team will control the game and the other will record the results on the tracking sheet.  Use two computers to run your simulation, one for the game and one for the tracking sheet.

Switch roles for round 2.

Person 1: Click here to start the Lemonade Game.  Try it out for a few days before you start the full 30 day round.  When your are ready to start refresh your browser screen and start the game over.  If you close your browser you have to start over.

Person 2: Track your progress using this Lemonade Stand Tracking Sheet  Save a copy and share it with your partner.  When complete add the link to your Google Classroom assignment.

Each day you sell lemonade your team will need to answer these questions.

  1. How much lemonade will we make?
  2. How will we let our customers know about our Lemonade stand?
  3. How much will we charge for the Lemonade?
  4. What will impact demand?
  5. How will we track sales?

Identifying the economic activities involved in the activity on page 2 of the Note catcher

  • Identify the production activities involved in creating the product
  • Identify the distribution activities.
  • Identify the consumption activities.
  • Determine how many products were sold.
  • Determine the team profit or loss.
  • Account for the differences in sales and profit for all of the 30 days.

When you have completed the simulation answer the reflection questions on the Note catcher.

Now that you are an expert at selling Lemonade, play the simulation again and record your results on the Second Round tab of the Lemonade Tracking Sheet.  Use what you learned in round 1 to see if you can improve your total Net Profit after 30 days.

Remember to switch roles in round 2.

You will have time next class to complete the simulation.  During the last 20 minutes of the next class we will debrief as a class.  Your team should be prepared to discuss the following:

  • Identify the production activities involved in creating the product
  • Identify the distribution activities.
  • Explain how you decided on the number of signs used to advertise your stand.
  • Identify how you decided on the price you charged for each day.
  • Identify the external factors impacting consumption activities.
  • Identify what your team did to counter these factors.
  • Determine how many glasses were sold.
  • Determine the team’s net profit or loss for each round.
  • Account for the differences in sales each day.
  • Describe the strategy changes you made in the second round.
  • Did your second round net profit increase or decrease? Why?

January 9 – 20, 2017 FBLA Preparation

FBLA Logo

FBLA District Leadership Conference is Tuesday February 7, 2017 at the Arapahoe County Fairgrounds in Aurora.

You will have every class period between now and January 20, 2017 to work on these events and take the on-line tests

Click here for FBLA 2017 Registration

Click here for the FBLA Competitive Event Reference Guide

Test events must be completed by Friday January 20, 2017 at 4:00pm.

See Mr. Polete or Mrs. Count to get your login and password to take the tests you are registered to take.

Production events must be finalized and uploaded to the FBLA District 10 website by Thursday January 20, 2017 at 3:00pm.

Be sure to send or share your files with Mr. Polete or Mrs. Cpimt before 3:00pm on Friday  January 20, 2017.

If you are not participating in the FBLA District Leadership Conference, then you will choose one or two non-participant partners and develop a 7 minute presentation to be delivered on January 19 & 20, 2017 on one of the following topics:

    1. Research the ethical issues of social media platform checks in relation to employment.
    2. In the ever-changing world of business communication and demand for instantaneous information, discuss the issues surrounding cloud computing in relation to storage, access, and security. Be prepared to argue the affirmative, that cloud computing would positively answer the demand for instantaneous information; and be prepared to argue the negative, that cloud computing is not the answer to instantaneous information.

    3. Consumers are shopping at traditional brick and mortar stores, on Web sites, and increasingly through mobile applications. Does the availability of a mobile application provide a business with a stronger consumer base and higher revenue? Argue either the affirmative or negative that having a mobile application increases consumer base and revenue for businesses

    4. You have been asked to give a presentation to a group of small business leaders in your community on how the repeal of the Affordable Care Act will likely impact their community.

January 9 & 10, 2017

Click here to join Google Classroom

Join the class using your class’ code:

Period 2 66ue70

Period 4 wcjvtuj

Period 7 a0gvf13

Do Now: Mid Year Reflection

As you get ready for the rest of the 2016-2017 school year you should take a moment to reflect on the first semester.

  • What went well for you?
  • What would you like to do differently this semester?
  • How will you learn from your successes and disappointments to improve?
  • Are you on track to graduate with your class?
  • If not what can you do to get back on track?

Objective:  Students will write a reflection of Semester 1 and identify strategies this semester that will help them be on track to graduate.